Statistics
Uncover actionable insights
Go beyond the numbers and discover key takeaways
you can use to improve your business.
14-day trial, no credit card needed!
All your data at a glance
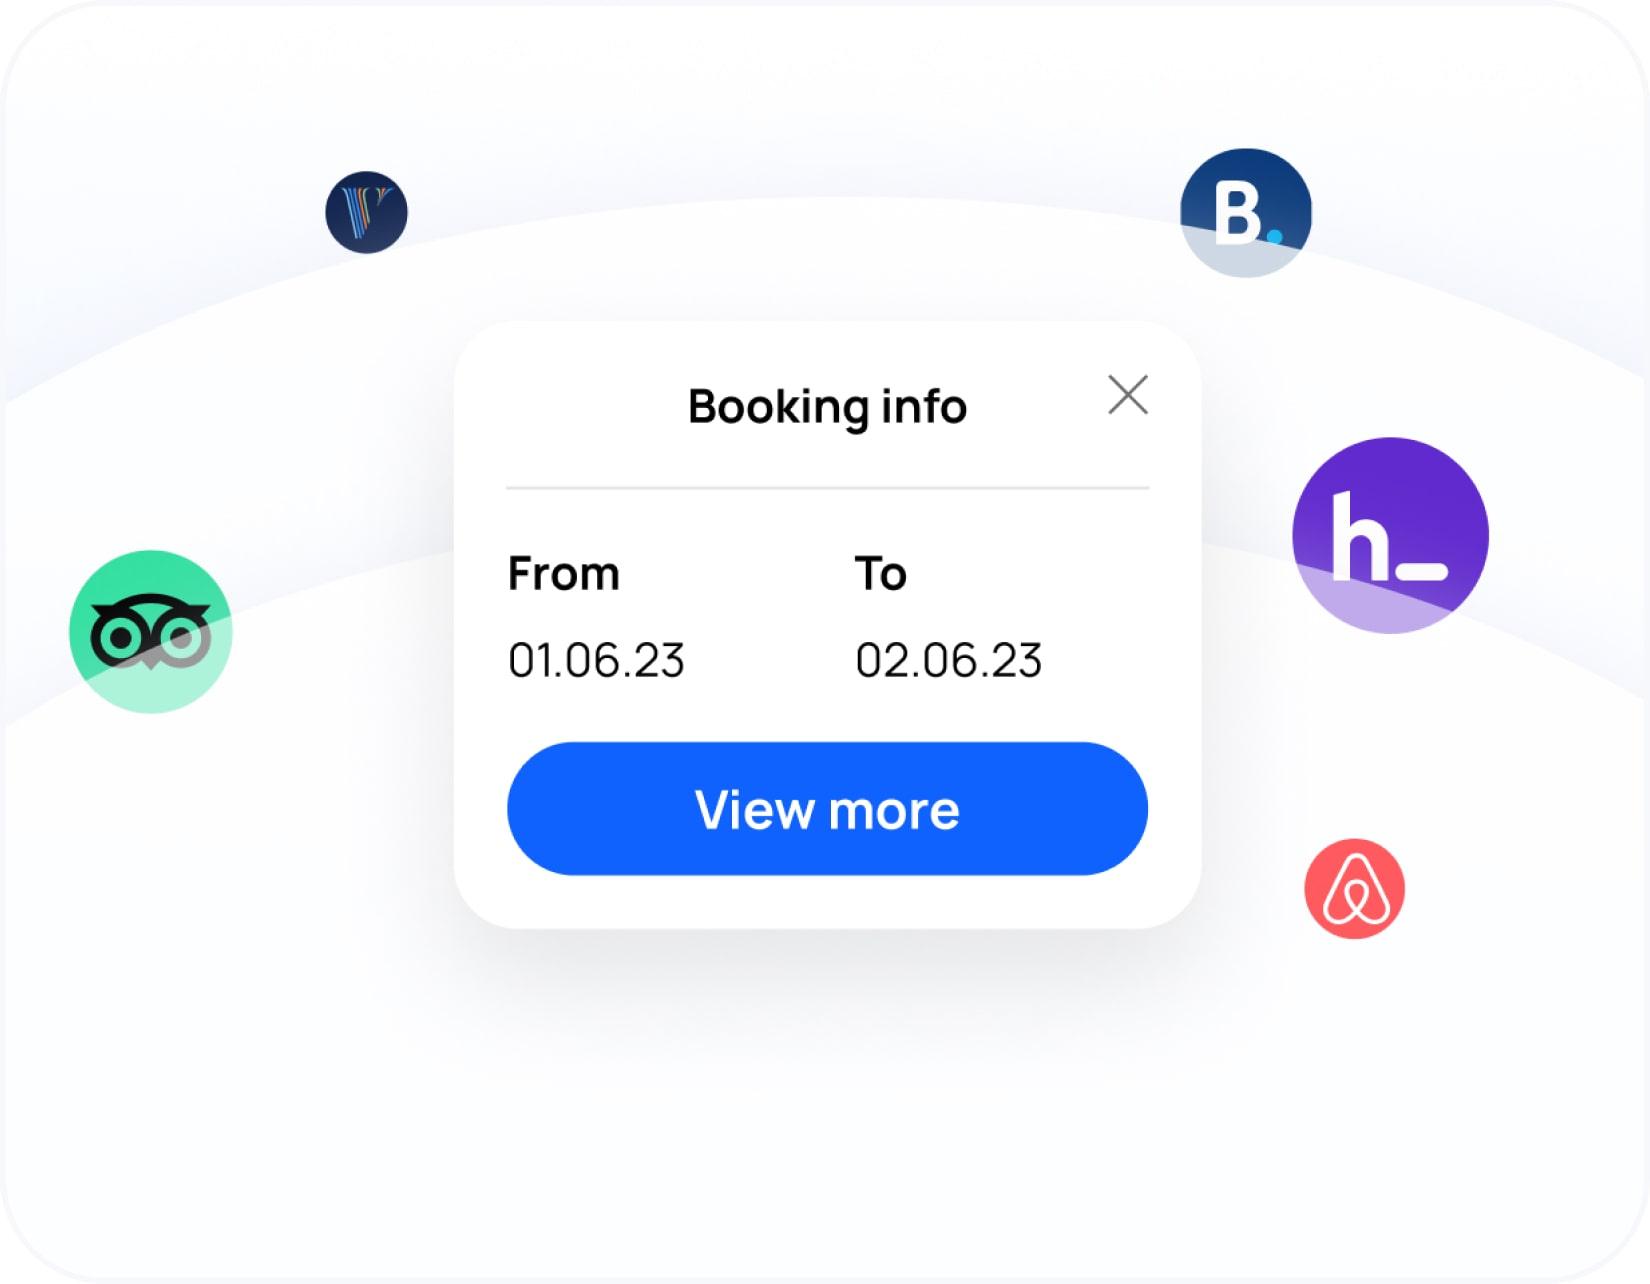
Dashboard Overview
A bird's-eye view
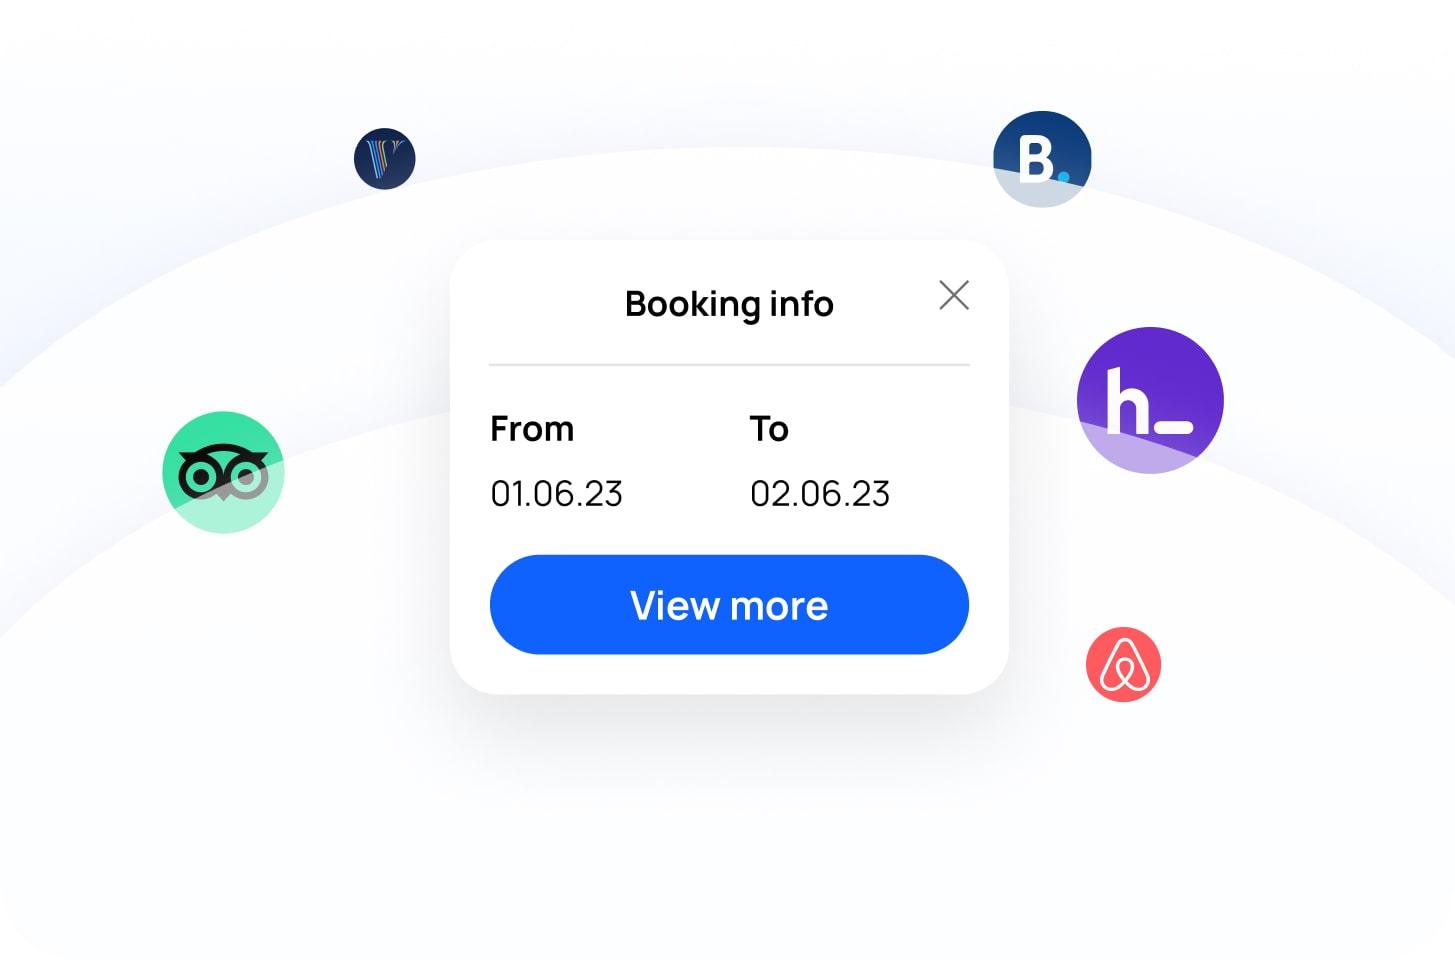
Access all your booking data from connected platforms in one dashboard for easy monitoring.
Data Insights
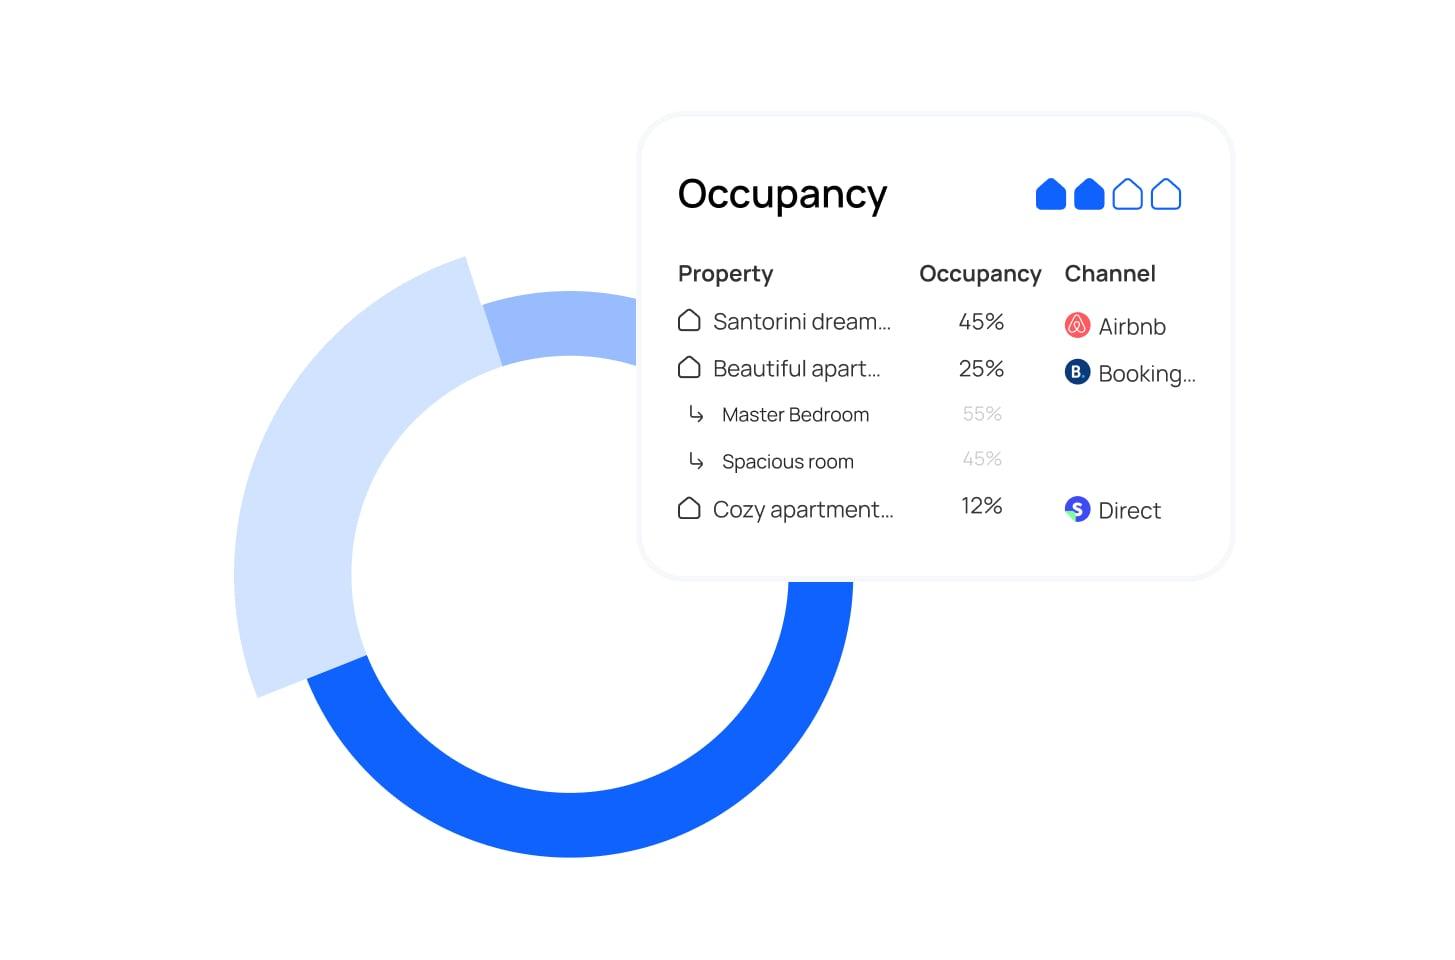
In-depth analysis
Examine occupancy rate, revenue, and booking trends across platforms to drive informed business decisions.
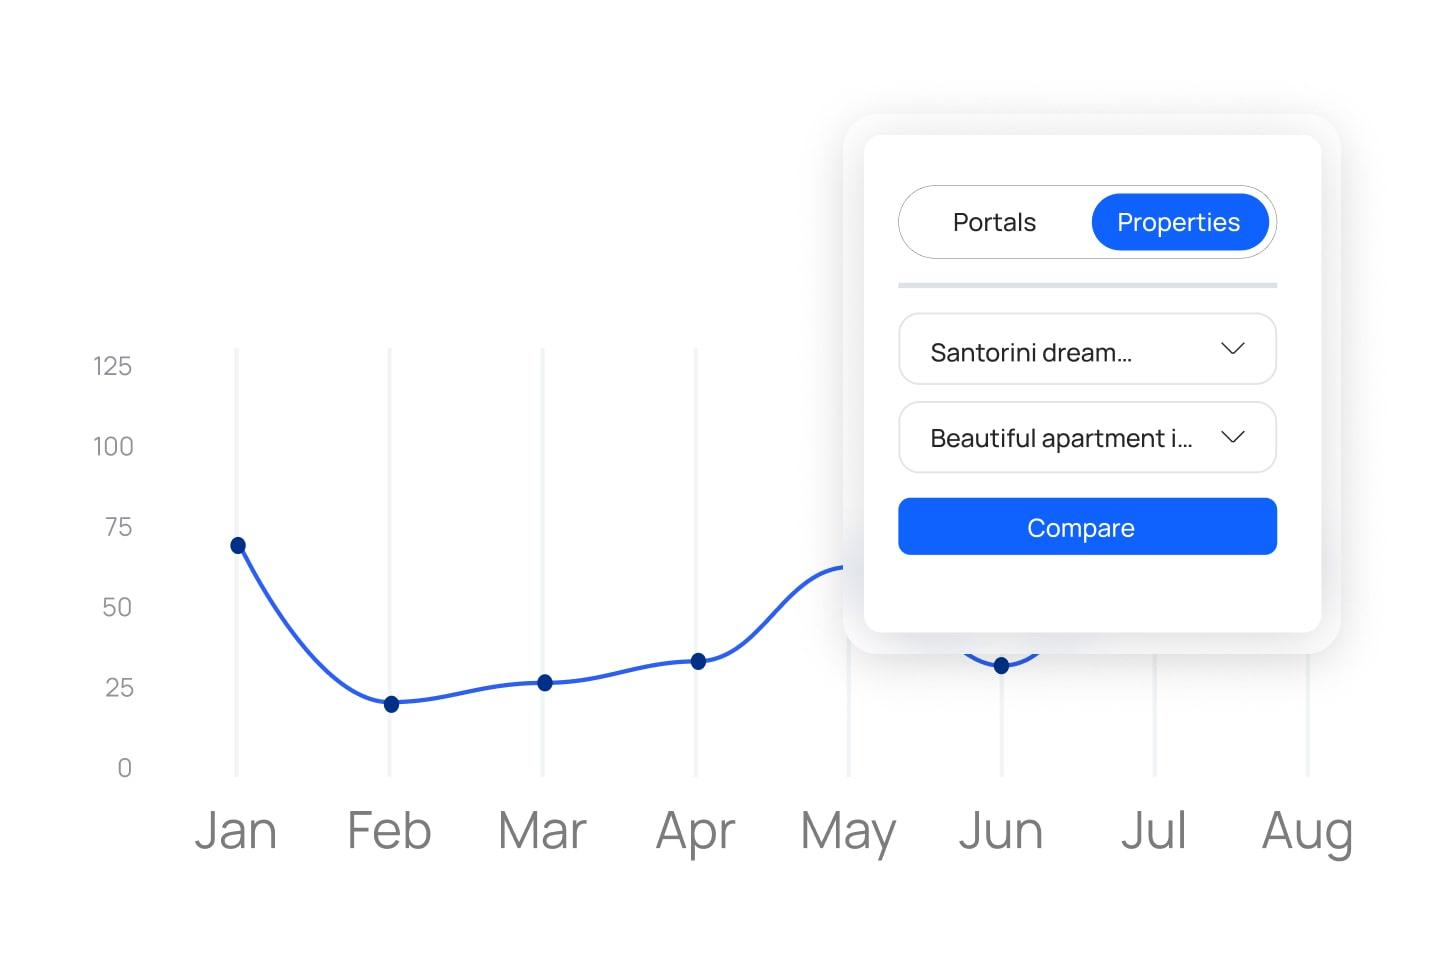
Smart Filters
Drill down into the details
Filter by time range, access strategic data, and find actionable insights.
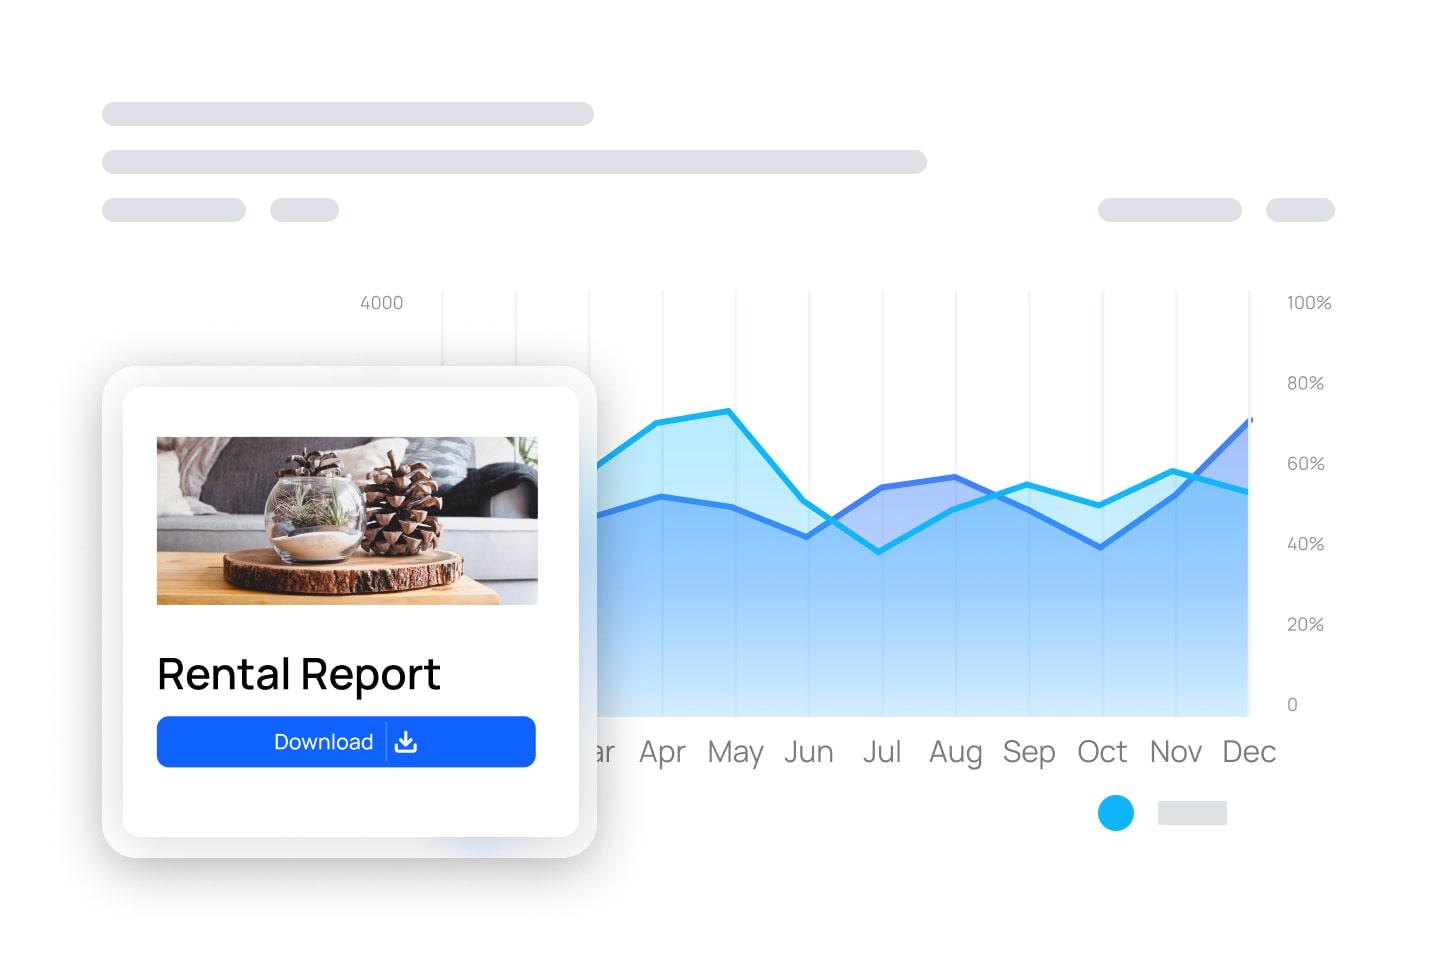
Reports
Create detailed reports
Generate PDF, Excel, or CSV reports to study your data in greater detail.
Trusted by the best in the industry
Don’t just take our word for it

Hasan
This is by far the best option for a channel manager. Has all the features you need with no extra charges and actually works.

Rebecca
I have used Smoobu for 4 years now for my 6 listings and use it as a booking engine on my own website. It works wonderfully. I love the ease of use as a user and to set up.

Stefano
Made my life easier, and automatized many processes that were manual before. And it's still cheap!
Find the right plan for you
Professional Flex (Beta)
From €23.20/month
Everything included in Smoobu Professional Prepaid but with a 0.9% booking fee.
Professional Prepaid
From €28/month
Powerful automation and advanced features to streamline your rentals with a 0% booking fee.
Teams Pro+
From €44/month
Scale up your vacation rental business and operations to the next level with a 0% booking fee.
Tailored for every kind of property

Manage all of your vacation rentals, from single apartments to large portfolios, thanks to centralized bookings and performance tracking.

Improve your hotel's performance through direct bookings and guest communications while preserving the charm that makes it special.

Combine memorable guest experiences with streamlined management thanks to detailed guides and centralized bookings.

Make guest house operations efficient with centralized bookings and access rights, while maintaining the warm experience your guests love.

Keep every aspect of your campsite organized and highlight what makes you unique with personalized messaging and bespoke branding.

Offer guests an authentic farm experience while streamlining operations through centralized bookings and tailored guest communication.
Have questions?
Statistics or KPIs (key performance indicators) enable you to visualize a trend based on collected data over a defined period and draw informed conclusions. The vacation rental data analytics will help you enhance your business's performance.
Use Smoobu's analytics tool to highlight data such as occupancy rate, average revenue, number of overnight stays, cancellation rate, etc, to make more informed decisions to optimize the management of your rental and its future success.
Calculate the occupancy rate of a vacation rental by following this formula:
Occupancy rate calculation: (number of nights booked / number of nights available) x 100For example, you have a vacation rental that is rented out on online booking platforms for 365 days a year. You have rented your vacation rental 287 nights out of 365. According to the occupancy rate formula seen below, we obtain the following calculation: (287/365)x100. Your average occupancy rate is, therefore, 78.6%. Track the occupancy rate directly in your dashboard.
Access your vacation rental analytics through dynamic widgets. For example, on channels such as Airbnb or Booking.com, you can quickly see the percentage of bookings per channel, the revenue per channel, and the nights per channel. You can also choose the type of graph you'd like to analyze: bar chart, pie chart, column chart, or pyramid chart."
Ready to simplify your workload?
14-day trial, no credit card needed!
